
Frequently asked questions
The node-based workspace, connected tools, AI and production insights behind your game.
39 answers
What is Retascope?
Retascope is a node-based production workspace for game studios. It connects the people, departments, tools and tasks behind a game with the conversations, meetings, assets and development activity that explain the work. Instead of opening each source separately, you can follow those connections from the studio overview into a department, task or supporting record.
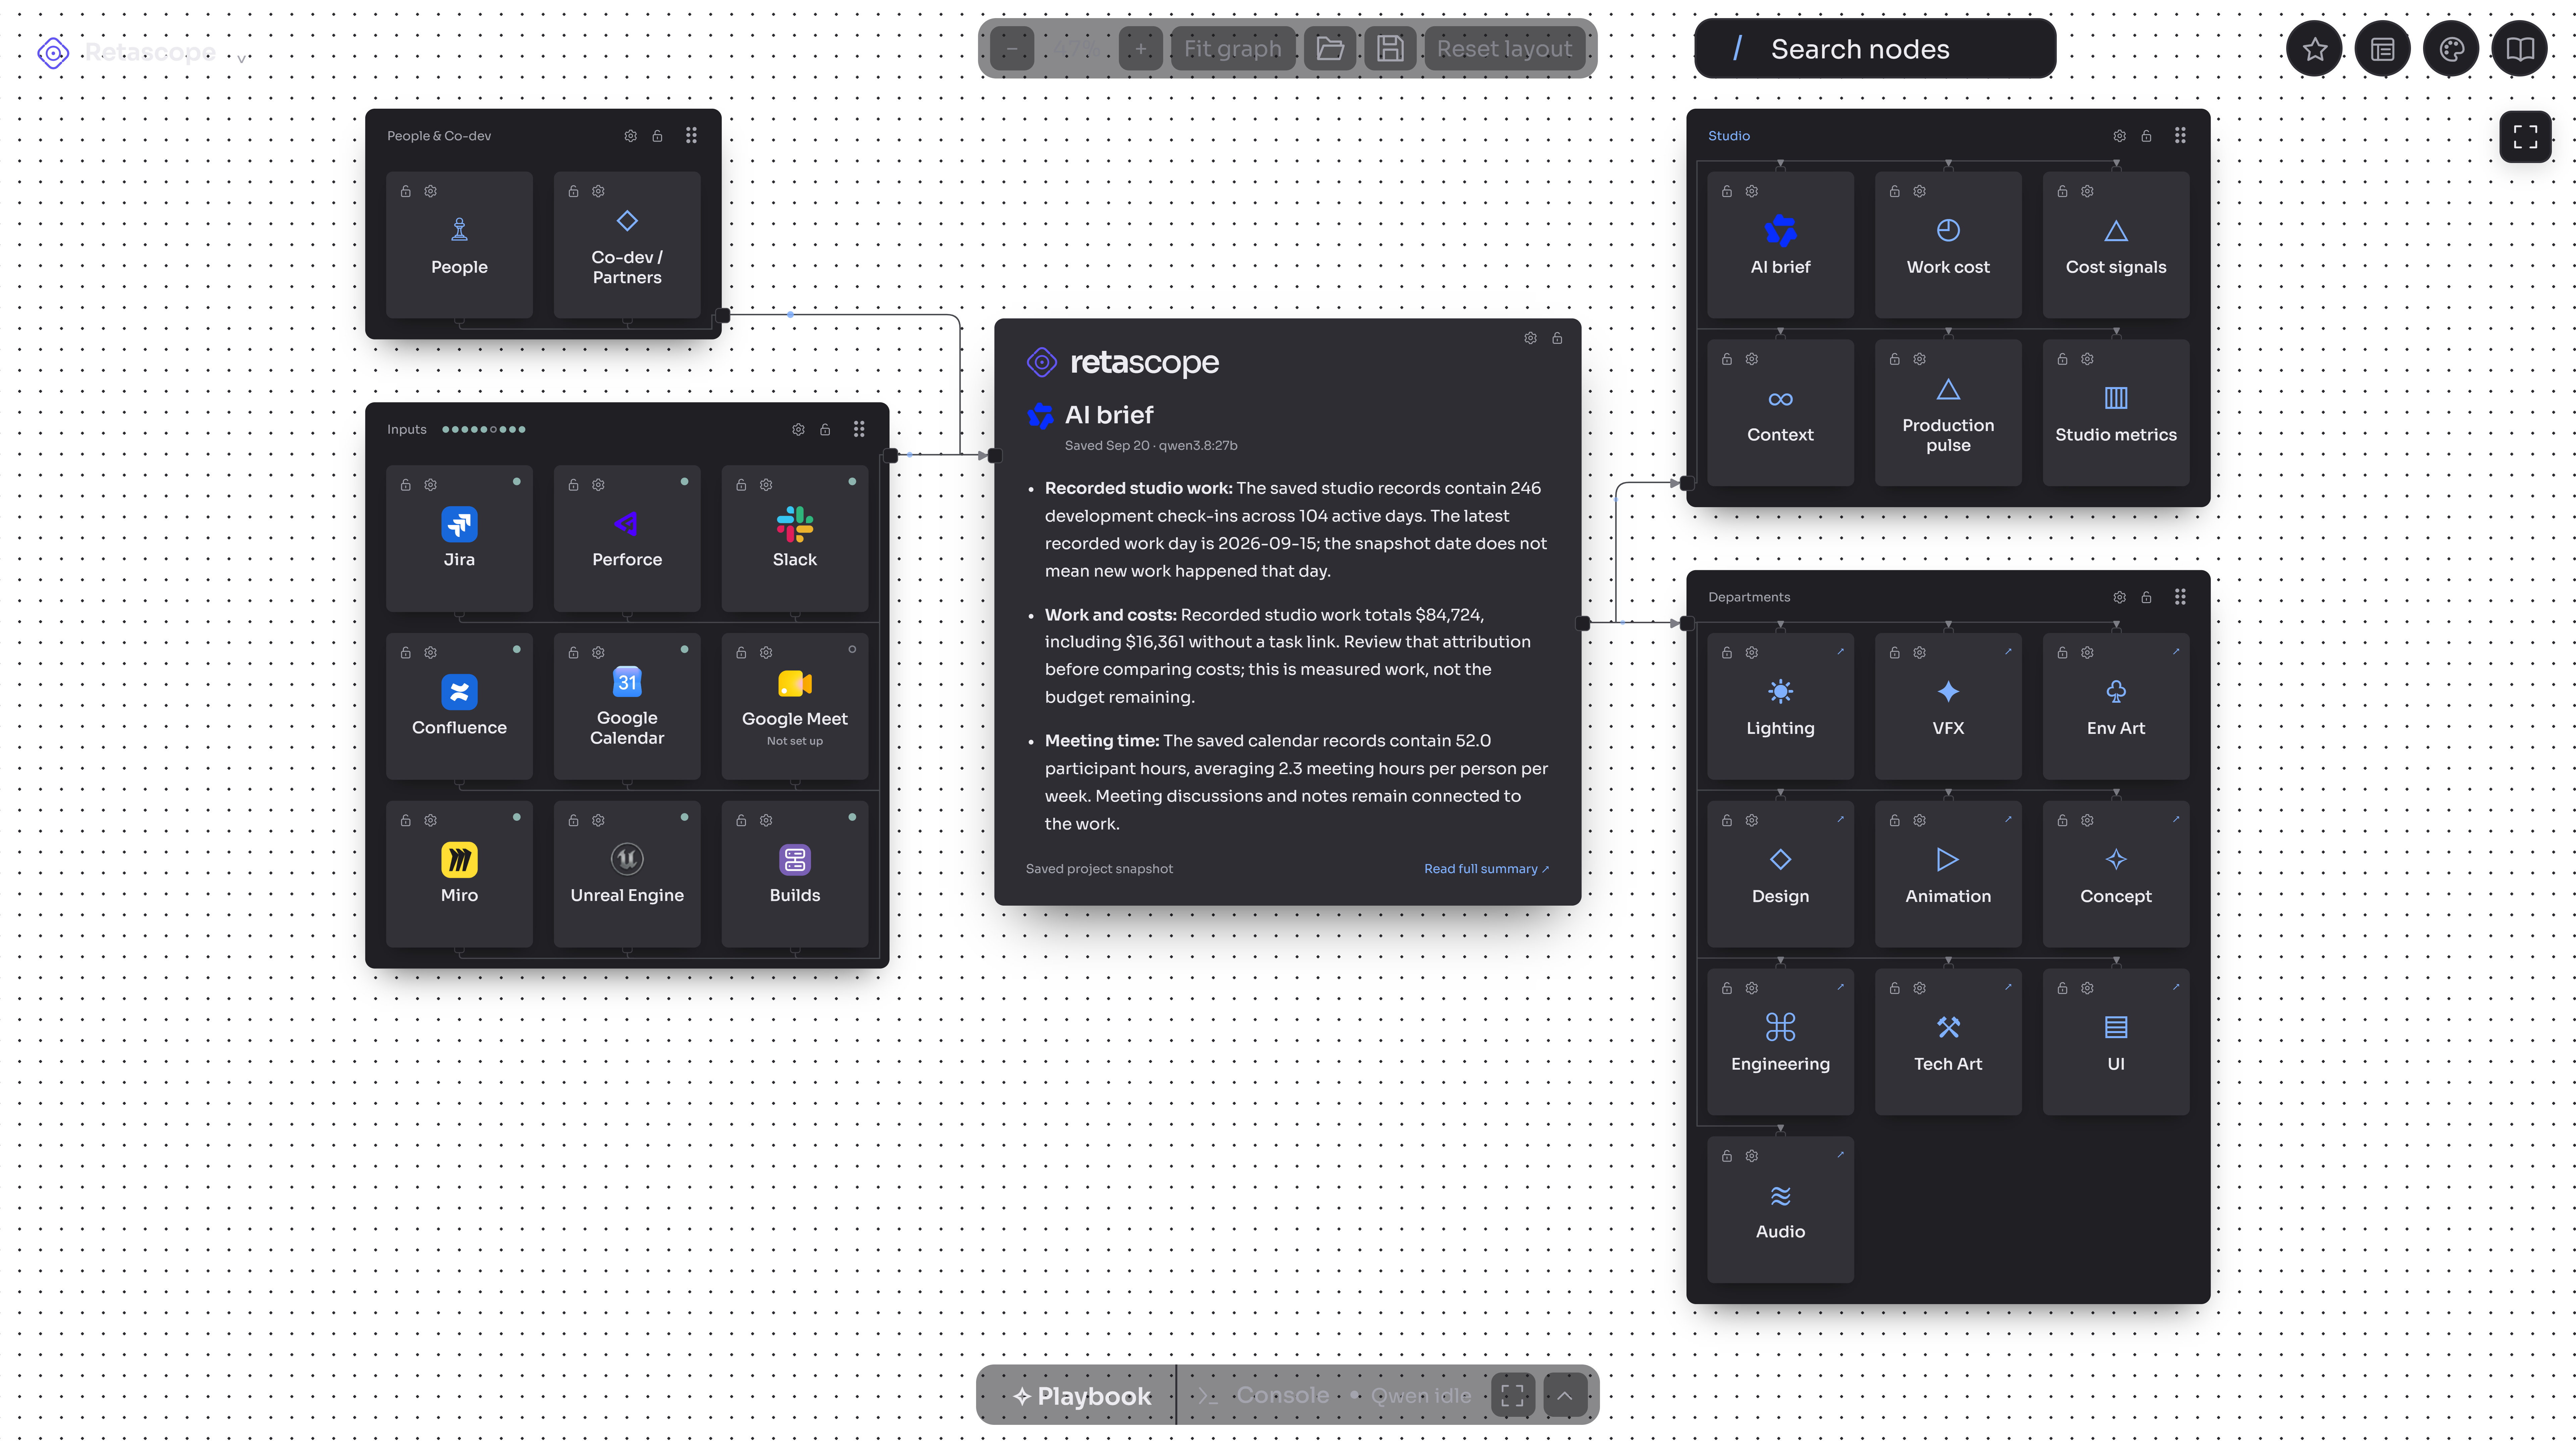
The graph is a working interface. Open Lighting, for example, then explore its tasks, meetings, conversations, people, assets, activity and costs. Open a task to inspect its timeline, contributors, file changes, decisions and references. Pan and zoom the graph, arrange and lock nodes, or switch to Focus mode for a page-first workspace with a Pages sidebar. Open views in separate windows to work across monitors.
Retascope helps you understand production from several angles:
- Time and cost: connect recorded editor activity and configured estimates to tasks and rates; inspect attributed and unlinked work, meeting time and comparable tasks.
- Context: bring Jira history, Perforce changes, Slack conversations, meeting notes and transcripts, Miro boards and other linked records alongside the work.
- AI briefs: summarize studio, department and task records so you can review progress, decisions, gaps and suggested next steps with supporting sources.
- AI playbooks: describe the review or output you need, inspect the generated workflow, follow its execution log and save it to rerun with a chosen date window.
- Reviews and sharing: connect task references and screenshot reviews, open a view fullscreen, and prepare reports, spreadsheets, presentations or visual exports.
- Production signals: inspect build outcomes, repeated asset edits, source health, automation activity and editor-performance evidence where those records are available.
The aim is to see where time and money go, reduce repeated searching and reporting, and give the team more time to make games. Results depend on the sources, plugins, permissions and rates your studio configures. Explore the actual app in the live demo →
Does Retascope replace Jira?
Retascope works with Jira. It collects tickets and status history and can create Jira tasks with ownership, a department, a brief, and selected references. It adds a connected production view around those tickets.
What can I see on a ticket?
Time and cost, contributors, an activity timeline, the task story, linked files, review boards, and supporting context. Conversations and meeting notes stay connected to the work they refer to.
How does context reach the right ticket?
Connected sources are matched using ticket references and related files. Configured AI can help match and summarize meeting passages. Uncertain links can be reviewed; confirmed or dismissed decisions are retained.
Can I create a ticket with references attached?
Yes. Enter the task name, department, owner, and optional description. Scan supported sources by keyword, review matches, and select the links to include with the new Jira task.
How are time and cost calculated?
Plugins for Unreal Editor, Photoshop, Maya, 3ds Max, MotionBuilder and Substance 3D Painter report the maps or saved files being worked on. Together with the local Retascope tray, they distinguish active work from idle time or an app left in the background. Recorded plugin time takes priority; configured Perforce estimates can cover remaining gaps without counting those hours twice.
Working hours, lunch, meetings, leave, other tasks and configured rates constrain attribution and cost calculations. A file left open or checked out is not continuous editing time. Source coverage and task links determine how much work can be attributed.
Can I compare similar work?
Comparable-work views show relevant tickets and their time and cost. Suggested relationships can be reviewed before confirmation. Comparisons use the data and configuration available to the studio.
How do screenshot reviews work?
An artist selects a task and Miro board, then enables automatic screenshot uploads. New matching captures can be added to the board. Uploads start off, can be paused, and preserve the original captures on disk.
Where is data stored?
Your installed Retascope stores project records in a local SQLite ledger on the studio’s machine or server. Connected services and enabled AI features make requests to their configured providers. The public demo uses sanitized sample project data.
Can I share reports?
Yes. Export selected views and pages to PDF, Excel, PowerPoint or images, copy data, or prepare outputs for Miro and Confluence. Available formats depend on the view and the output you choose.
Is the featured ticket connected to the app?
The public demo uses a sanitized project snapshot so you can explore the app without connecting to a real studio’s accounts. In your installed app, ticket views use the records collected from your own connected tools.
What does Retascope connect to?
Jira, Perforce, Slack, Miro, Confluence, calendar and meeting services, and build results. Editor plugins support Unreal Engine, Adobe and Autodesk tools, with an SDK for your own engine. Connections and coverage depend on your studio’s permissions and settings.
Do we need Unreal Engine?
No. Supported Adobe and Autodesk plugins and the plugin SDK can record editor activity from other tools or your own engine. Perforce records also support estimates for files made without an editor plugin.
How do we connect our own engine?
Use the plugin SDK to send editor activity and operation events to Retascope. A Python SDK is included; other languages can send the same JSON event format.
What are playbooks?
Describe what you need in Playbook. A playbook saves a reusable graph that gathers app records, keeps source references and a date window, and prepares the reports, slides or data outputs you choose.
Does it change anything in our tools?
Collection reads your configured sources. Enabled actions can create or update Jira records, post Slack digests or answers, and add Miro items or screenshot uploads. These actions use the permissions and settings you choose.
How is work time measured?
Recorded active time from an editor plugin takes priority. Focus, idle state and active assets support attribution. Perforce activity can provide a separate estimate for gaps. Working hours, lunch, meetings, leave and competing tasks constrain the counted time.
Do checkouts count as work time?
No. A checkout’s duration and time in a Jira status are different from active working time. Retascope shows these records separately.
Can an AI suggestion change a cost?
An unconfirmed AI suggestion does not assign work time. Reported time and costs use accepted attribution rules, recorded activity and your configured rates; suggested links remain available for review.
Where do the rates come from?
From the rate bands you configure, individual payroll where enabled, and contracted partner rates. Attributed work time is combined with those rates to calculate production cost.
Where does the AI run?
Retascope uses the model service you configure. Local models can run through Ollama, or your studio can use a dedicated AI server. The public demo shows prepared examples without connecting to a production AI service.
How are salaries handled?
Where individual payroll is enabled, authorized operators can import salary and job-title data. Payroll is stored encrypted, and import access and personal pay visibility follow the installed app’s role settings.
Can artists see costs?
The artist workspace shows tasks, references and work time without calculated financial fields. Producer and executive views use the studio’s configured access roles.
How is it installed?
Use Docker Compose or a local installation on a studio machine or server, then connect your tools and configure working time and rates. Built-in diagnostics help check the connections.
What does the editor performance report need?
An editor plugin on the artists’ machines: Unreal Engine, supported Adobe or Autodesk tools, or your own engine through the SDK. It records operation timing and failure evidence for performance reports. Raw crash dumps and call stacks are not uploaded.
What does “node-based” mean?
A node represents something you can explore, such as a connected tool, department, task or record. The graph shows these items in groups with visible connections, so you can follow the context around the work.
Click a node to open its graph or page. For example, follow Retascope → Departments → Lighting → Tasks, then open a task and explore its supporting records. The graph and reading pane let you keep the broader context while reviewing the detail.
Can I use Retascope without navigating the graph?
Yes. Focus mode presents the selected page with a searchable Pages sidebar. You can navigate studio, department and task sections there, then return to Graph mode when you want to see their connections.
The two modes provide different ways to explore the same workspace. Switching modes does not require creating a separate project.
Can I arrange nodes and customize the workspace?
You can pan, zoom and fit the graph, move nodes and groups, lock positions, and save or load layouts. Square and rectangular node shapes keep their own arrangements.
Choose Dark, Light, Slate, Tan, Violet or Satin, change the font and grid pattern, or use the Theme editor to adjust the canvas, groups, node surfaces and accent colors.
Can I work across multiple monitors?
Open a page in its own window so the graph can stay on one screen while a task, cost view or conversation stays on another. Independent windows let you compare supporting information without repeatedly replacing the main view.
You can also add a second page pane within the workspace, resize the panes, and use page zoom or fullscreen to give a particular view more room.
What do the AI briefs explain?
Studio, department and task briefs summarize the collected records for that scope. They can bring together progress, recent work, decisions, production issues and suggested next steps. Opening the full brief gives you more detail and supporting records than the central overview node.
A brief reflects the records and model configuration available to the app. Source links, timestamps and coverage matter: a saved snapshot is not evidence that new work happened today.
How does an AI playbook work?
Describe the result you need, such as a review of a task with its conversations, meeting context, costs and screenshots. AI turns the request into a node-based workflow connecting the relevant sources, processing steps and output.
Inspect the plan, follow the execution log as records are gathered, and review the result. Save the playbook and rerun it with the relevant inputs or date window instead of rebuilding the same review each time. Available outputs depend on the workflow and configured connections.
Can I check where an AI result came from?
Linked sources and supporting records let you inspect the context behind a brief or playbook result. Task views include the activity timeline, conversations, meeting material, assets and other references used to understand the work.
Suggested relationships can be reviewed before confirmation. Uncertain matches and missing source coverage should remain visible rather than being treated as established facts.
How do conversations and meetings connect to production?
Linked Slack discussions, meeting notes and transcripts sit alongside the departments and tasks they concern. This helps you connect a decision or review request with the changes, files and work that followed.
Task and department sections let you inspect the underlying discussion. Configured AI features can use that same context in briefs and playbooks, so review preparation starts from linked records.
What can I see at studio and department level?
Studio and department views bring together task delivery, contributors, work time, costs, meeting load and recent activity. You can move from a summary figure into the relevant task or supporting record.
Production pulse, cost signals and studio metrics help you inspect the recorded work from different angles. Figures depend on collected evidence, attribution settings and configured rates; measured cost is not the remaining budget.
Can Retascope help identify rework and production delays?
Repeated asset edits, task history, build outcomes and editor-performance records can help identify work worth investigating. Comparable tasks and linked conversations add context before you decide what caused a difference.
A revised asset is not automatically wasted effort, and a failed build alone does not establish its impact on the schedule. These views help you inspect the evidence rather than assigning a cause without context.
Which formats and destinations can I export to?
Depending on the view, you can create PDF reports, Excel spreadsheets, PowerPoint presentations and images, copy data, print, or prepare content for Miro and Confluence. Some views also let you collect items into a PowerPoint deck.
Open a chart, card or entire page fullscreen to inspect it and reach its export controls. The available export options are shown for that view.
How do I know whether the information is complete?
Source health and connection settings show whether configured services are connected, stale, failing or not set up. Attribution and automation views expose linked records and gaps in coverage.
Missing telemetry does not mean no work occurred. For example, editor delays and crashes remain unknown without the relevant plugin records, and work without a task link should be reviewed separately from task-attributed cost.
Can playbooks run on a schedule?
Yes. Open a saved playbook and expand Schedule to choose a daily, weekly or one-off run, with a time zone. Retascope reruns the saved workflow against fresh collected records and shows the next run. You can pause it at any time.
Your Retascope server must remain online; the browser can be closed. Runs wait if another playbook is active, and missed occurrences combine into one run after restart. Archiving pauses the schedule. Downloads and external exports still require their export action.
The live demo replays saved sample data while its page is open. It saves schedules in that browser and catches up once when you return.
How do editor and art-tool plugins improve time tracking?
The Unreal Editor plugin reports map and asset context. Plugins for Photoshop, Maya, 3ds Max, MotionBuilder and Substance 3D Painter report saved documents, scenes or projects. The local Retascope tray combines that context with app focus and time since input to measure active work intervals, excluding idle and background time.
Confirmed task links, declared assignments and supported check-in evidence connect files to tasks. Work without a matching task remains visible as unattributed work. Measured plugin hours take priority over Perforce estimates, so the same work is not counted twice. Configured rates turn attributed hours into measured costs.
The plugins must be installed and the tray running. Photoshop tracking currently requires Windows; unsaved or unsupported documents and interruptions can leave gaps. Plugins report activity context rather than keystroke contents or document contents. Check source health and the per-app breakdown when reviewing accuracy.
No matching questions. Try “time”, “Jira” or “data”.
Still have a question? Contact us